

By: John Huber Maryland K12.com
The Blueprint for Maryland’s Future grew out of the Commission on Innovation and Excellence in Education, widely known as the Kirwan Commission, which the General Assembly created in 2016 to examine whether Maryland’s funding system was adequate and equitable and to recommend policy and funding changes capable of moving the state toward the performance of top systems worldwide. You can trace the formative steps and deadlines in the state’s official Blueprint timeline and in background summaries of the law’s origin and scope on the Blueprint overview site.
The Commission based its recommendations on the 2016 adequacy study by Augenblick, Palaich & Associates and comparative work by the National Center on Education and the Economy, which compared Maryland to high-performing systems such as Finland, Singapore and several leading U.S. states. An overview of that research appears both in the state’s timeline and in the Maryland Association of Boards of Education’s briefing materials on the Blueprint’s development and pillars.
A statewide nonprofit coalition called Strong Schools Maryland promoted the Blueprint as a “once-in-a-generation opportunity to build a world-class education system.” The official Accountability and Implementation Board materials make that aspiration explicit, including the pledge to enable schools and students to perform at the level of the world’s best. See the state’s Explore the Blueprint page for the core statement of goals.
The Five Pillars
The Blueprint’s policies were built around five pillars. Pillar 1 expands high-quality early childhood education, including full-day prekindergarten and strengthened wraparound supports through Judy Centers and other programs, with the intent that all children enter kindergarten ready to learn. The state’s accountability materials describe these elements and their purpose under the accountability section.
Pillar 2 elevates and diversifies the educator workforce via a career ladder, higher standards and compensation, a minimum starting salary target of 60,000 dollars, and more time within the day for collaboration and development. Policy summaries and legislative presentations from the Maryland Association of Boards of Education capture these changes in context. See MABE’s December 2023 overview of the Blueprint’s launch and lessons learned, which details compensation provisions and the career ladder structure.
Pillar 3 centers on college and career readiness, emphasizing rigorous coursework, expanded dual enrollment and CTE pathways, and industry-recognized credentials, with the idea that graduates will be prepared for post-secondary education or high-wage careers. Background on this pillar’s aims appears in general summaries of the Blueprint law and in the AIB’s materials. [dls.maryland.gov]
Pillar 4 directs more resources to students most in need through targeted formulas for low-income students, multilingual learners and students with disabilities, together with community school investments and other supports described in the state’s accountability page.
Pillar 5 creates a new governance and accountability architecture through the AIB, which oversees local implementation plans and requires reporting intended to move monitoring from activity to measurable results. The state’s explainer outlines this structure and its intent.
What It Was Supposed to Cost
From the start, no one said the Blueprint would be inexpensive. Legislative descriptions and independent summaries have long spoke of a target of roughly 3.8 billion dollars in additional annual state education spending at full implementation, with tens of billions over the first decade. A readable capsule of the law’s scope appears on Wikipedia’s legislative summary page, which tracks with the amounts discussed during passage and implementation. Commentary and news analysis in Maryland also pointed out the absence of a fully identified long-term revenue plan at the start of this endeavor and warned that costs would climb as mandates phased in. Maryland Public Policy Institute’s overview of the state’s wider fiscal pressures and coverage of early warnings about the Blueprint’s price tag.
Implementation: What Happened, What Slipped, and What Remains Partial
Full implementation was always intended to unfold over roughly ten years. In practice, timelines were adjusted, with the General Assembly revising some dates in 2022 to account for the veto-override gap and pandemic disruptions. The state’s timeline shows these legislative adjustments and the staggered rollout.
Early childhood access expanded, but universal full-day pre-K has not been realized uniformly across districts. Educator compensation and career-ladder statutes were enacted, but local execution and staffing realities have been uneven, particularly in high-need schools. College and career pathways widened on paper, yet capacity constraints and employer participation vary by region. Funding for targeted student groups rose, while statewide evidence of causal gains remains limited. The AIB’s oversight exists and requires local plans, though much of the early focus has emphasized compliance and structure rather than proven outcome effects. The AIB’s program descriptions and MABE’s implementation brief provide a grounded sense of both progress and friction points.
A Complication in the Formulas
Another reality often missed in broad-brush descriptions is that the Blueprint’s new formulas did not produce uniform increases in state aid for every local system. The law reworks state aid using a weighted-student model and wealth equalization, which means the state expects higher local shares from jurisdictions deemed able to contribute more. The state’s explainer on Blueprint funding lays out how base, weighted and program amounts interact, and the Department of Legislative Services warned in January of 2022 that the shift to requiring counties to fund the local share of each major program, combined with the Maintenance of Effort floor, would strain some local budgets as mandates phase in.
Worcester County is a great example. In AIB briefings with county leaders, officials acknowledged a calculated local share under the Blueprint that sits below the county’s Maintenance of Effort level, which means new state dollars often replace rather than supplement prior local spending in several program areas. Local news accounts of that meeting and subsequent budget sessions describe how the wealth calculation limits Worcester’s state share, leaving the county to cover a larger slice of items like National Board supplements and to absorb faster-rising costs in areas such as dual enrollment and special education.
From Promise to Results
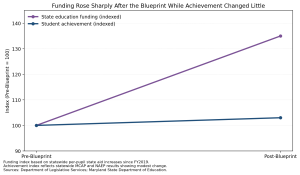
The Blueprint’s promise was not only to spend more, but to produce markedly better outcomes. Looking at the main statewide measures, the story is mixed.
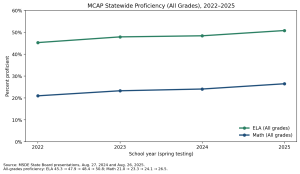
On MCAP, the state’s own 2023–24 summary shows English Language Arts proficiency at 48.4 percent, a slight uptick from the prior year, while mathematics stood at 24.1 percent, with pronounced middle-grade challenges and large differences across districts. The details are in the MSDE State Board presentation and the department’s release describing the literacy rebound and math lag.
On NAEP, Maryland’s 2024 reading results at grades 4 and 8 were about the national average, while math remained below the national average. Grade 4 math improved from 2022, but Grade 8 math was flat. The MSDE briefing that the State Board reviewed in February 2025 captures both the state rankings movement and the widening gap between higher and lower performers over the last decade. See the NAEP results deck for the granular findings.
On readiness, remediation remains a stubborn feature of the postsecondary landscape. The Maryland Higher Education Commission’s series on remediation documents the share of students who still require developmental coursework and finds that those who are assessed to need remediation and do not complete it are much less likely to return the following year.
Placed together, these indicators suggest stabilization and pockets of improvement, especially in literacy, but they do not yet show the systemic transformation implied by the Blueprint’s original pitch. That is why the next set of questions center on the relationship between spending and results and on how costs are distributed.
Record Spending and Local Cuts
It perplexes many readers to learn that statewide education spending is at record levels while local boards reduce positions, increase class size and cut programs. Yet three dynamics make this possible. The state’s commitment grew with the Blueprint and is phasing in through base, weighted and program formulas. Counties, however, must now meet the local share for multiple formulas, not just the foundation amount, and they must maintain or increase their previous per-pupil effort under Maintenance of Effort. Finally, federal relief dollars from COVID have ended just as mandates accelerated. The Department of Legislative Services’ analysis of local fiscal impact explains how those moving parts combine, and the state’s aid explainer describes how state and local shares are determined each year.
Baltimore County illustrates the local crisis. Recently, the board advanced a budget of 2.5 billion dollars that reduced hundreds of positions and indicated there will be larger class sizes to close structural gaps as enrollment shifted and federal funds expired.
Worcester County’s dynamic is different but arrives at a similar point. Because the county is classified as relatively wealthy, the state’s wealth formula limits Worcester’s state share. The county continues to fund well above the calculated local share through Maintenance of Effort, which is why local leaders described the Blueprint as requiring tough choices even as total statewide spending climbs.
Reports submitted to the AIB in 2024 show that many districts identified funding strain and resource tradeoffs among their top implementation challenges, even with overall growth.
Conclusion: From Promise to Proof
The Blueprint was conceived as a transformational investment that would marry money, equity and accountability to produce better outcomes. Years into implementation, the money is real, the mandates are real and the local pressures are real. The statewide data show improvement slightly up from pandemic lows and some literacy gains, yet math performance and readiness evidence have not rebounded in a way that would justify declaring the work complete, or even underway. The fiscal design of the Blueprint has increased the state’s role, but it has also forced counties into paying higher local shares and higher floors while federal relief from COVID has disappeared. The question now is less about intent and more about proof. Maryland will need clear, comparable evidence that the Blueprint’s scale of investment is producing results commensurate with its cost, or it will need to revisit the elements that are preventing the investment from working as promised. The state’s own MCAP and NAEP reports, together with MHEC’s remediation studies and DLS’s fiscal analyses, give Maryland the tools to make that judgment if policymakers are prepared to use them.